How are you doing on your key customer service metrics?

Rich Customer Service Dashboards and Reports

Service dashboards and reports that provide insights into your operations

Try for free

Free for 15 days. No credit card needed.

Service Dashboards and reports

Service CRM> The key metrics you need to watch
Time taken

Time taken for:

  • Assigning a ticket
  • Assign to estimate
  • Estimate to approval
  • Approval to Repair

Service dashboards and reports need to give you the metrics for you to know where the process bottlenecks are.

Load distribution and quality

Need data on ticket load by:

  • Service Center
  • Team or Technician
  • Ticket type- repair/ maintenance
  • Equipment type, etc

Customer service dashboards and reports need to give you easily digestible data on above.

Aid to plan

How does the week/ month look like in terms of scheduled activities?
Which days are busy, which technician is overloaded?

What are the pending service tickets? Which ones are awaiting approval? Do you have pending spares indents?
And of course a running summary of past 12 months of tickets logged and closed- just so you know what the trend is.

Team, territory or center performance

Which team is loaded? Which center is leading in performance? What equipment model is failing frequently?

Which spare parts seem to be most in demand?

You need to be able to get answers to specific questions.

Customer Service Dashboards field service

Installation, Repair, Maintenance or Refueling- whatever you do- we have you covered

Saleswah CRM helps you track and manage a wide variety of field service activities. Like Repair, Maintenance

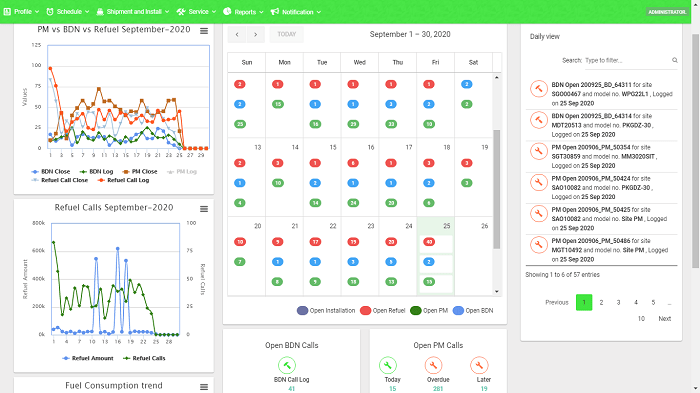
And from the dashboard you get a bird’s eye view of your operations- pending tickets, closed tickets, unassigned tickets. Spares indents requiring your approval. Scheduled visits that you need to approve.

And of course a calendar that shows how the weeks and months ahead are shaping up in terms of scheduled activities and the tickets in past that are still “open”.

Try for free

Free for 15 days. No credit card needed.
service center dashboard ticket management flow

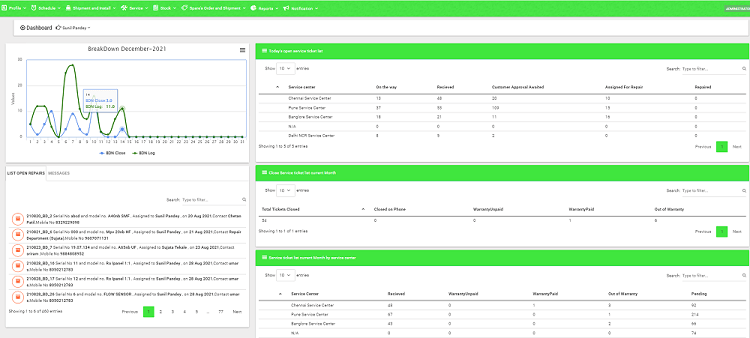
Easy to read, logically grouped dashboard  helps plan and track repairs

Saleswah CRM helps manage a wide variety of activities for a service center – incoming equipment, equipment under inspection, awaiting estimates, estimates under approval, equipment under repair, being handed over/ shipped out to customer.

And from the dashboard you get a bird’s eye view of your operations- pending tickets, closed tickets, unassigned tickets. Equipment sent by customer and on the way. Spares indents requiring your approval.

You get to see this grouped by service center or even at an individual technician level. You get to see what is pending, how many days and investigate why.

Try for free

Free for 15 days. No credit card needed.

Customer service reports> Rich and growing sets

The types of customer service reports in Saleswah

Unique in Saleswah, we allow you to create and download reports from not just regular data sets but also from the custom fields and forms that you have created.

We also allow you to port your data to your linked Google Workspace Sheet and further analyse it.

Standard reports

In this type of pre-built reports, we have various metrics on sites, accounts, contracts, installed base and of course reports on all types of service tickets- open and resolved.

Operations reports

The Operations Reports are Customer Service Reports that show you trends in key metrics like technican/ team loads over time- tickets assigned and closed.

These are also pre-built.

The difference with the standard reports are that these are aggregate values of metrics- so, you do not need to do the hard work of collating the information from raw data.

Custom reports

No matter the number of standard reports we continue to build, your needs will outpace us. Because each business is different. Your products, your processes, the metrics you capture are all a little different – even within the same industry.

So, we built custom customer service reports. Here we allow you to create your own reports using your own logic- by using a simple wizard we have built.

Create custom reports and save them and make it available to your team.

Push them to your favourite tool for analytics

You can download the reports into a csv file or even push them into your linked Google Sheet (Google Workspace account required) and perform all analysis using your favourite analytics tools.

[testimonial_view id="1"]